INFO/CS 3300 Showcase
https://mimno.infosci.cornell.edu/info3300/
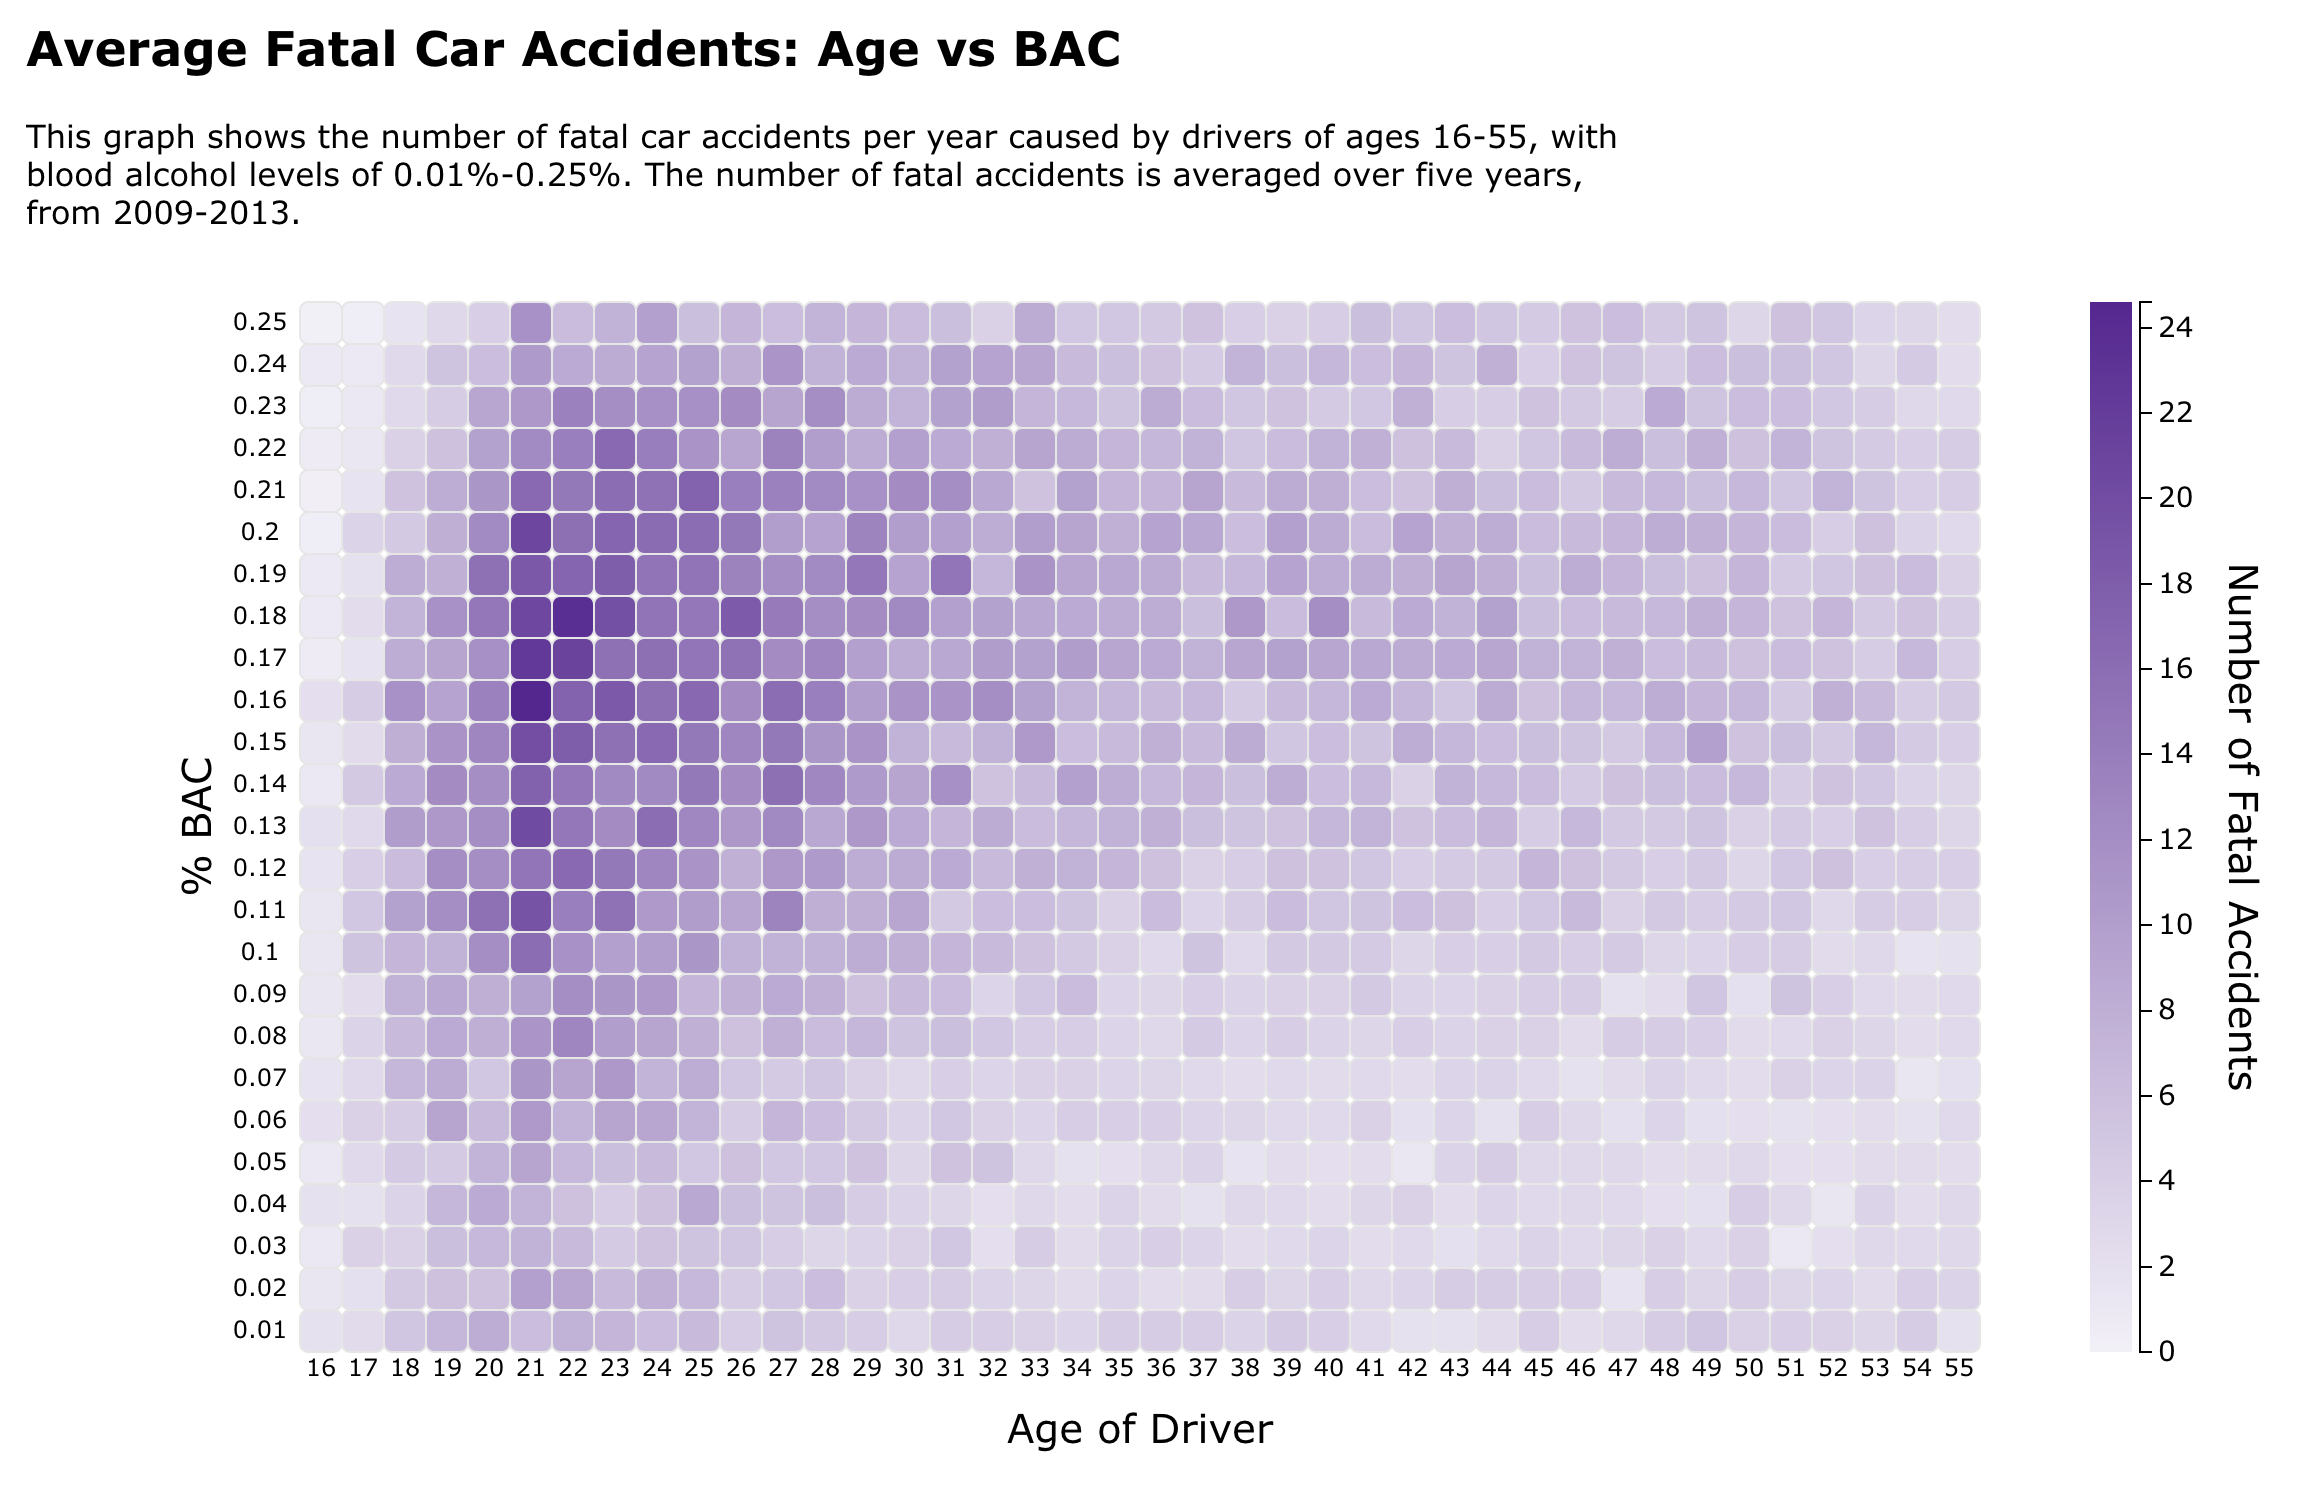
Drunk Driving
Average fatal car accidents by BAC, gender, and locale.Heatmaps, stacked bar charts, and chloropleth.
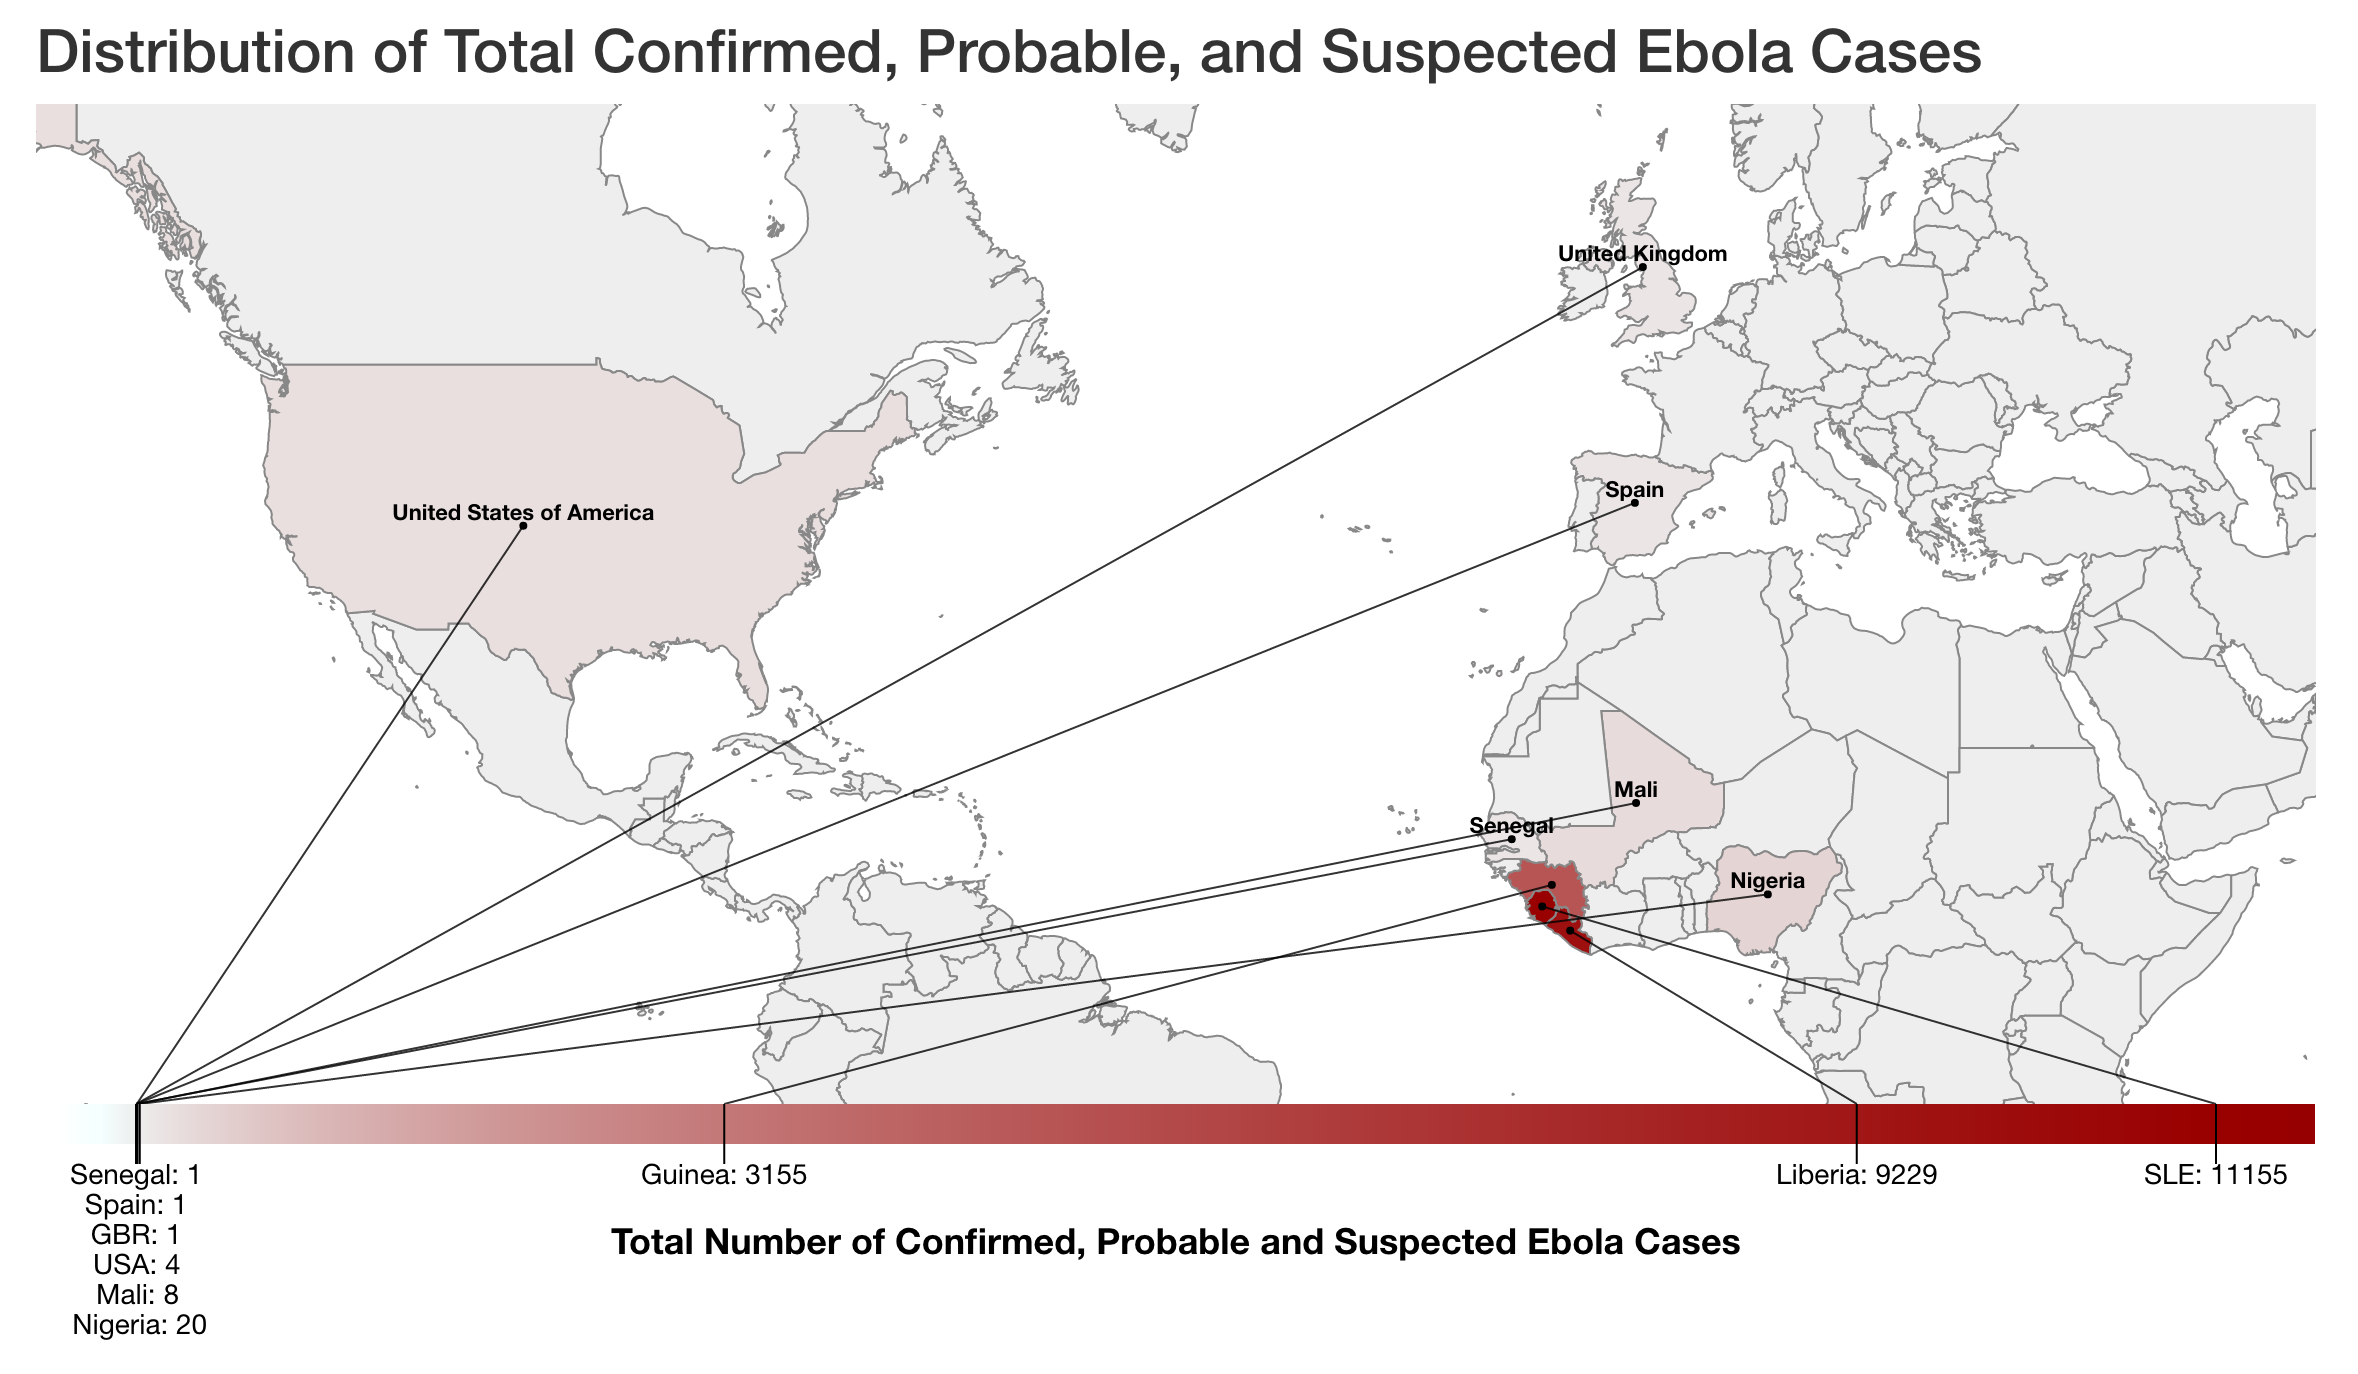
Ebola Pandemic
Spread of the ebola disease at the global scale.Symbol map, line graph, bullet chart, bubble graph.
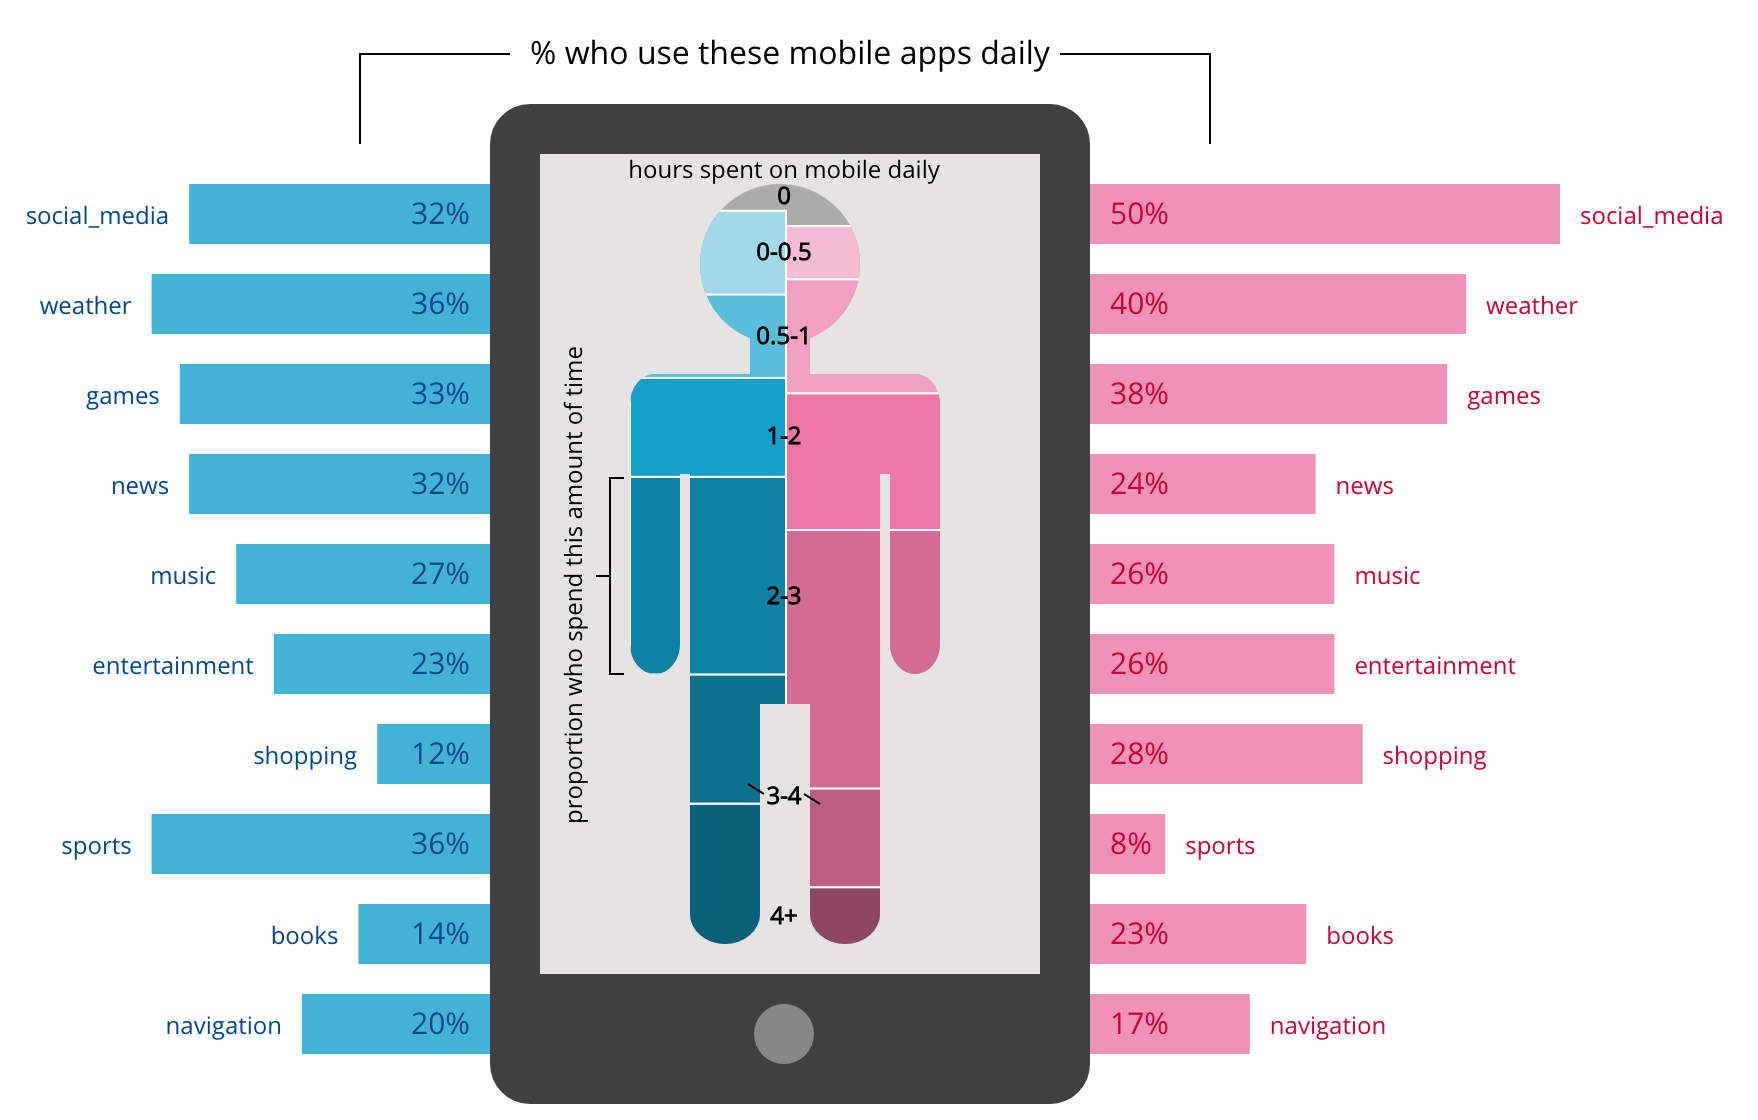
Gender and Mobile Use
Growth or decline in device ownership amongst Americans over the course of 4 years.Horizontal bar chart.
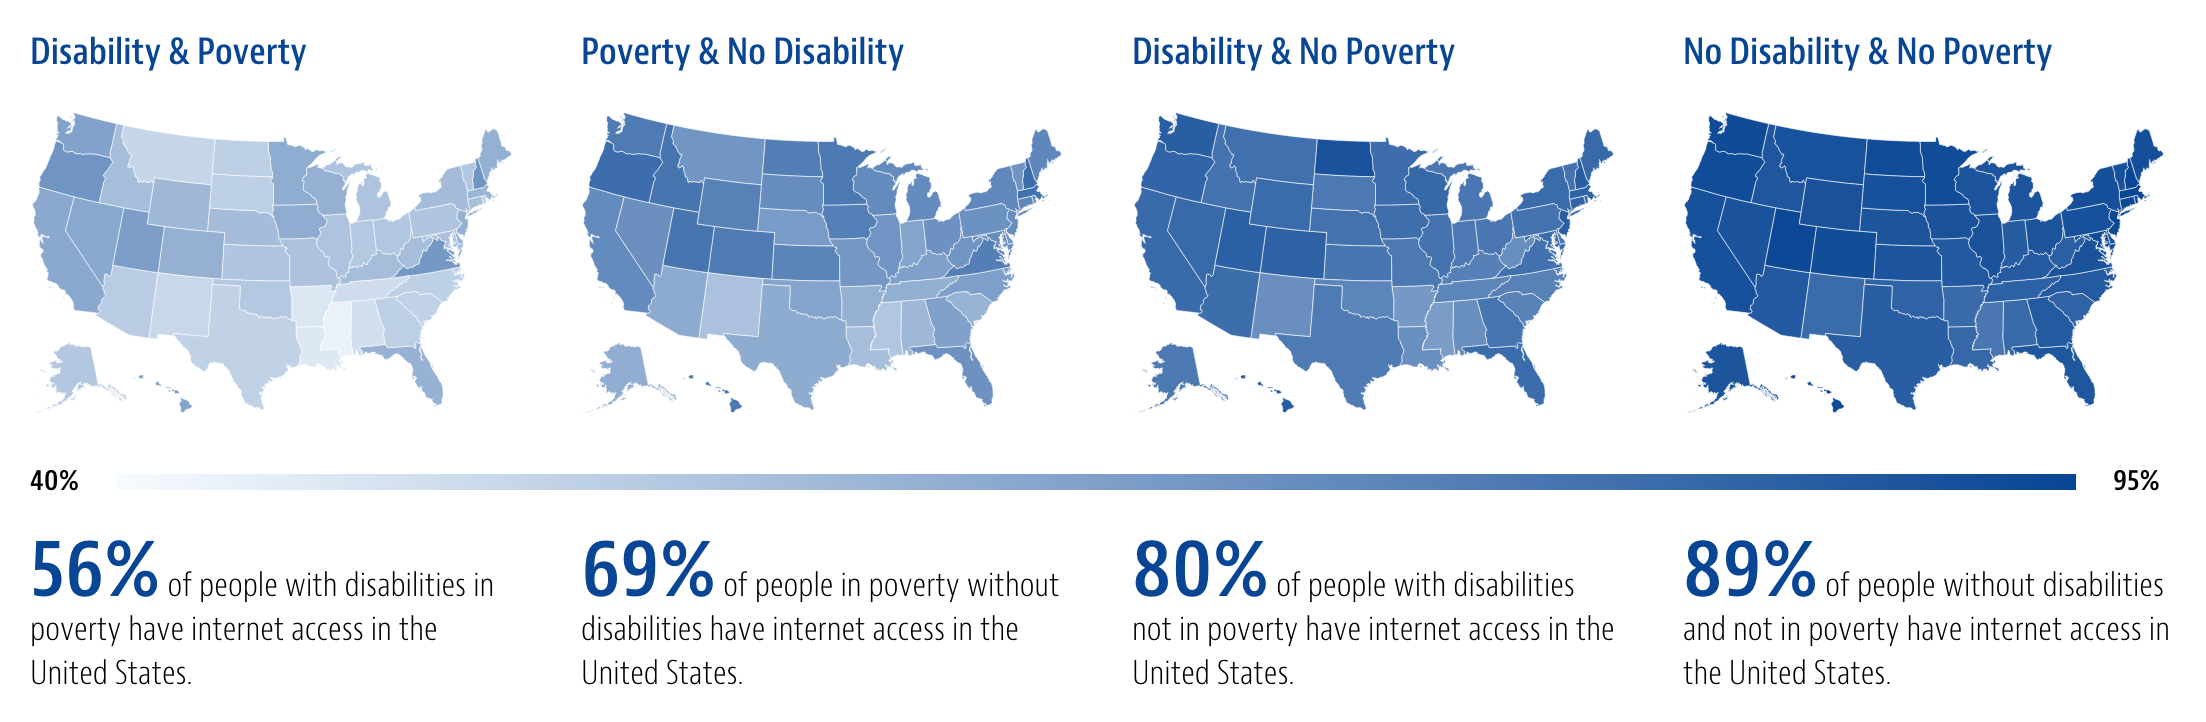
Internet Access Gap
Internet access in the United States by disability and poverty.Chloropleths, box plots.
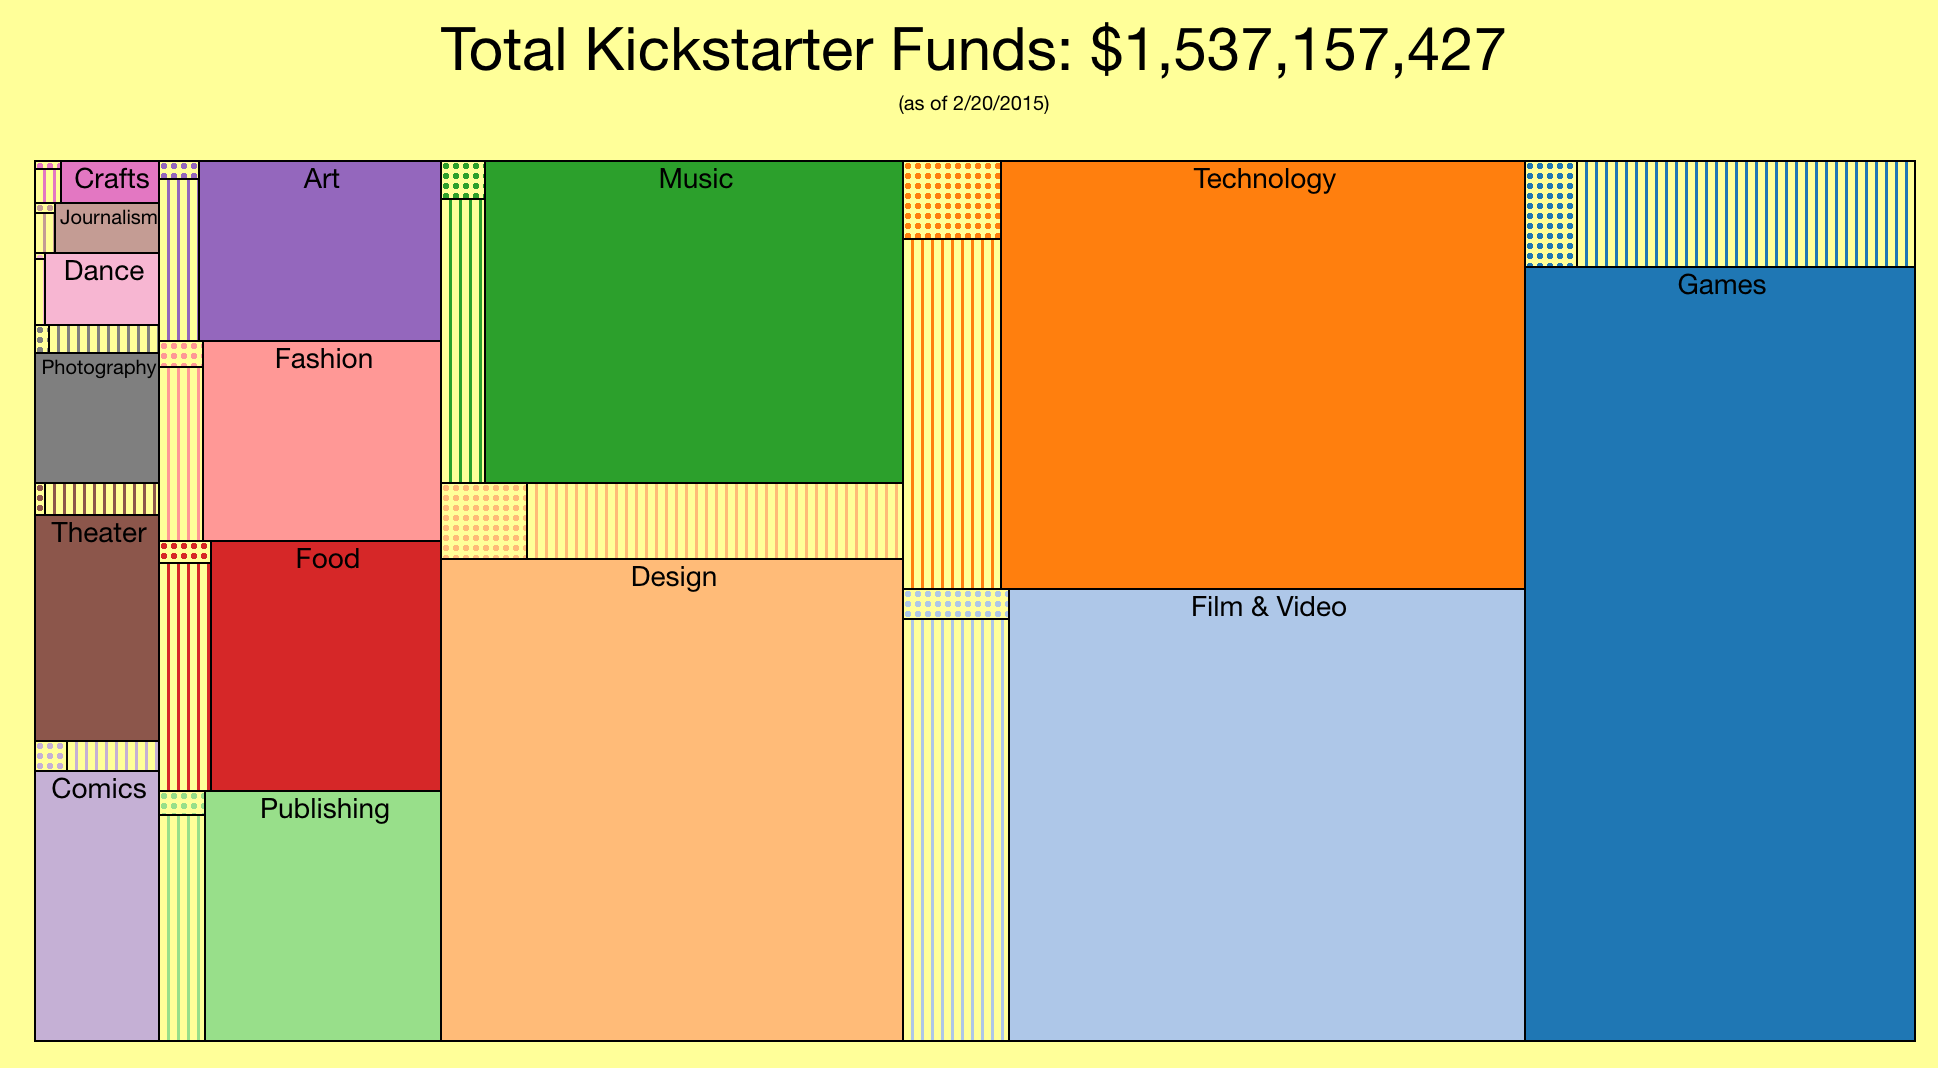
Kickstarter Project
Exploration of categories of Kickstarter projects and their success rates.Sunburst chart, treemap.
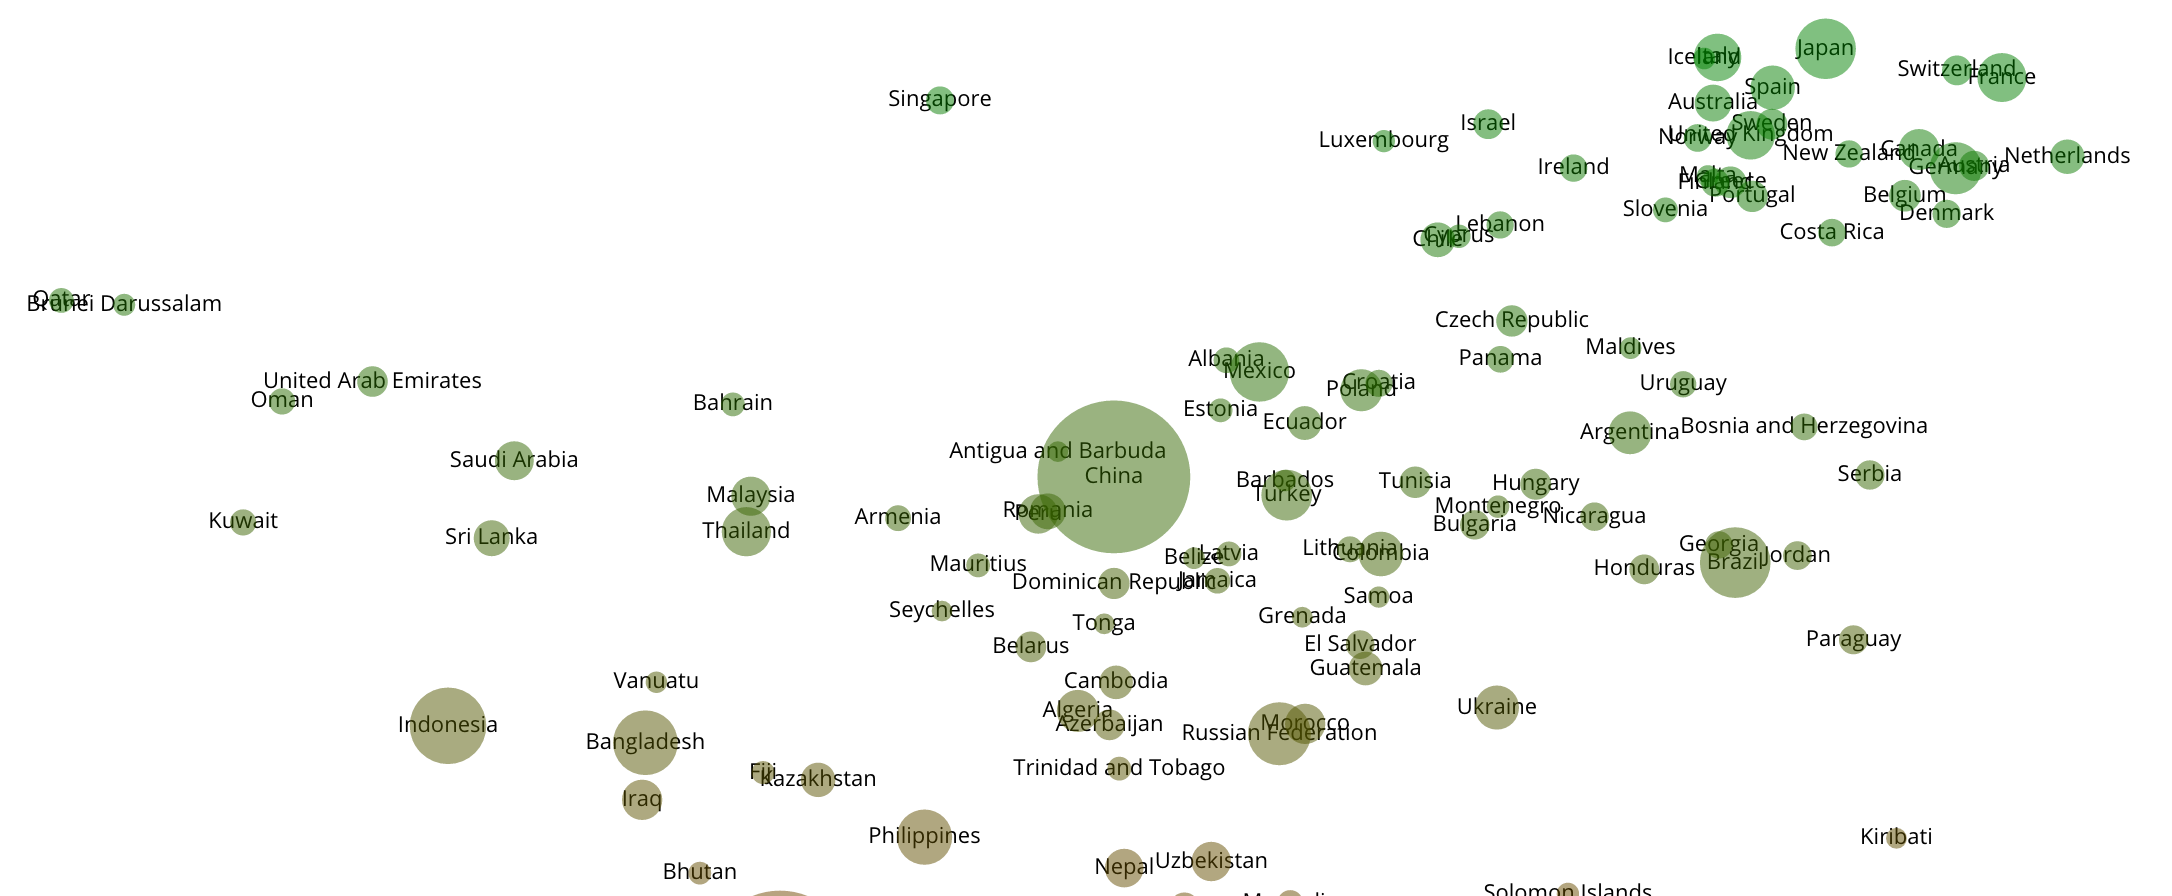
Life Expectancy
Percentage of a country's GDP spent on healthcare.Chloropleth, bubble chart.
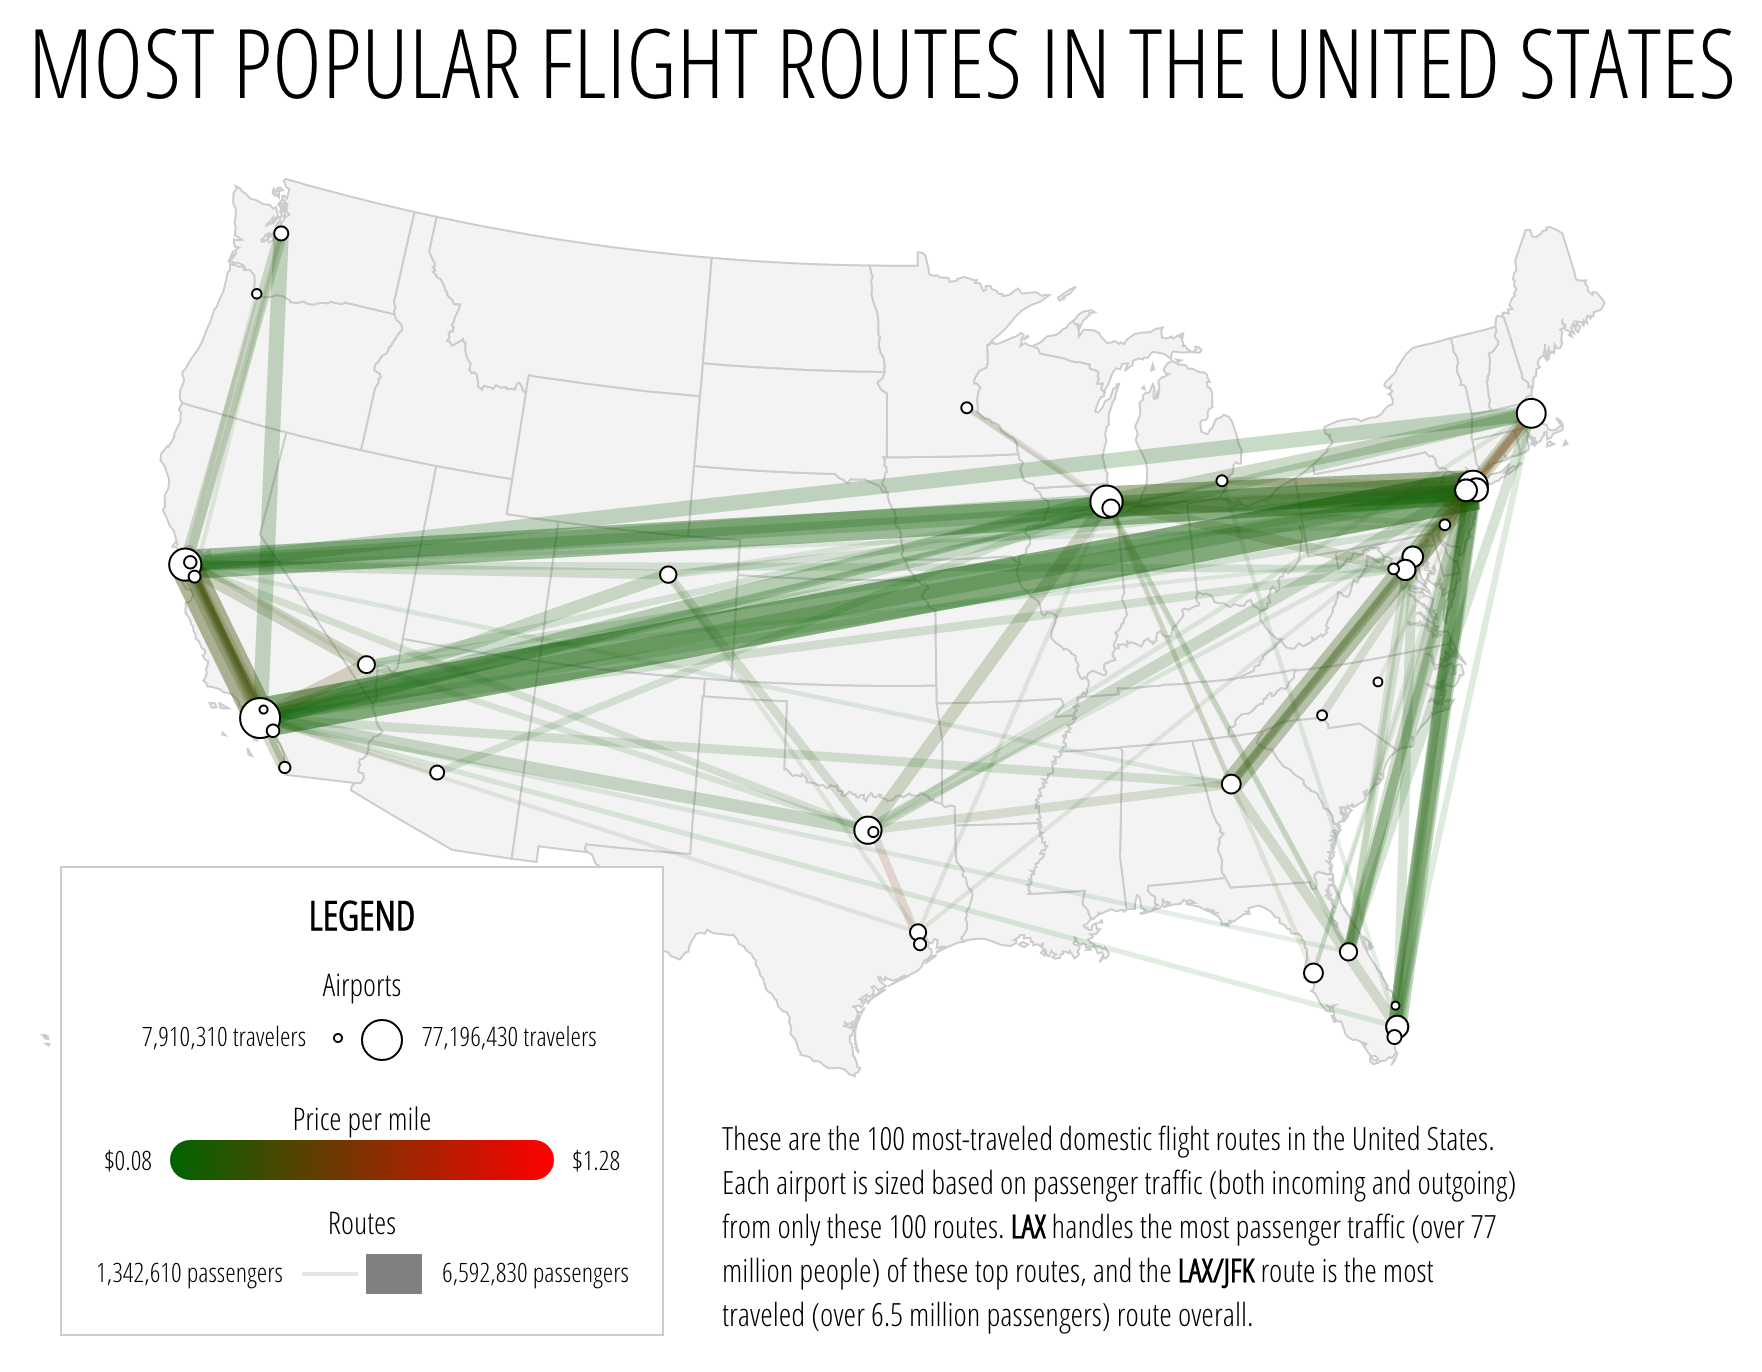
Popular Flight Routes
The most popular flight routes in the United StatesSymbol map, heatmap.
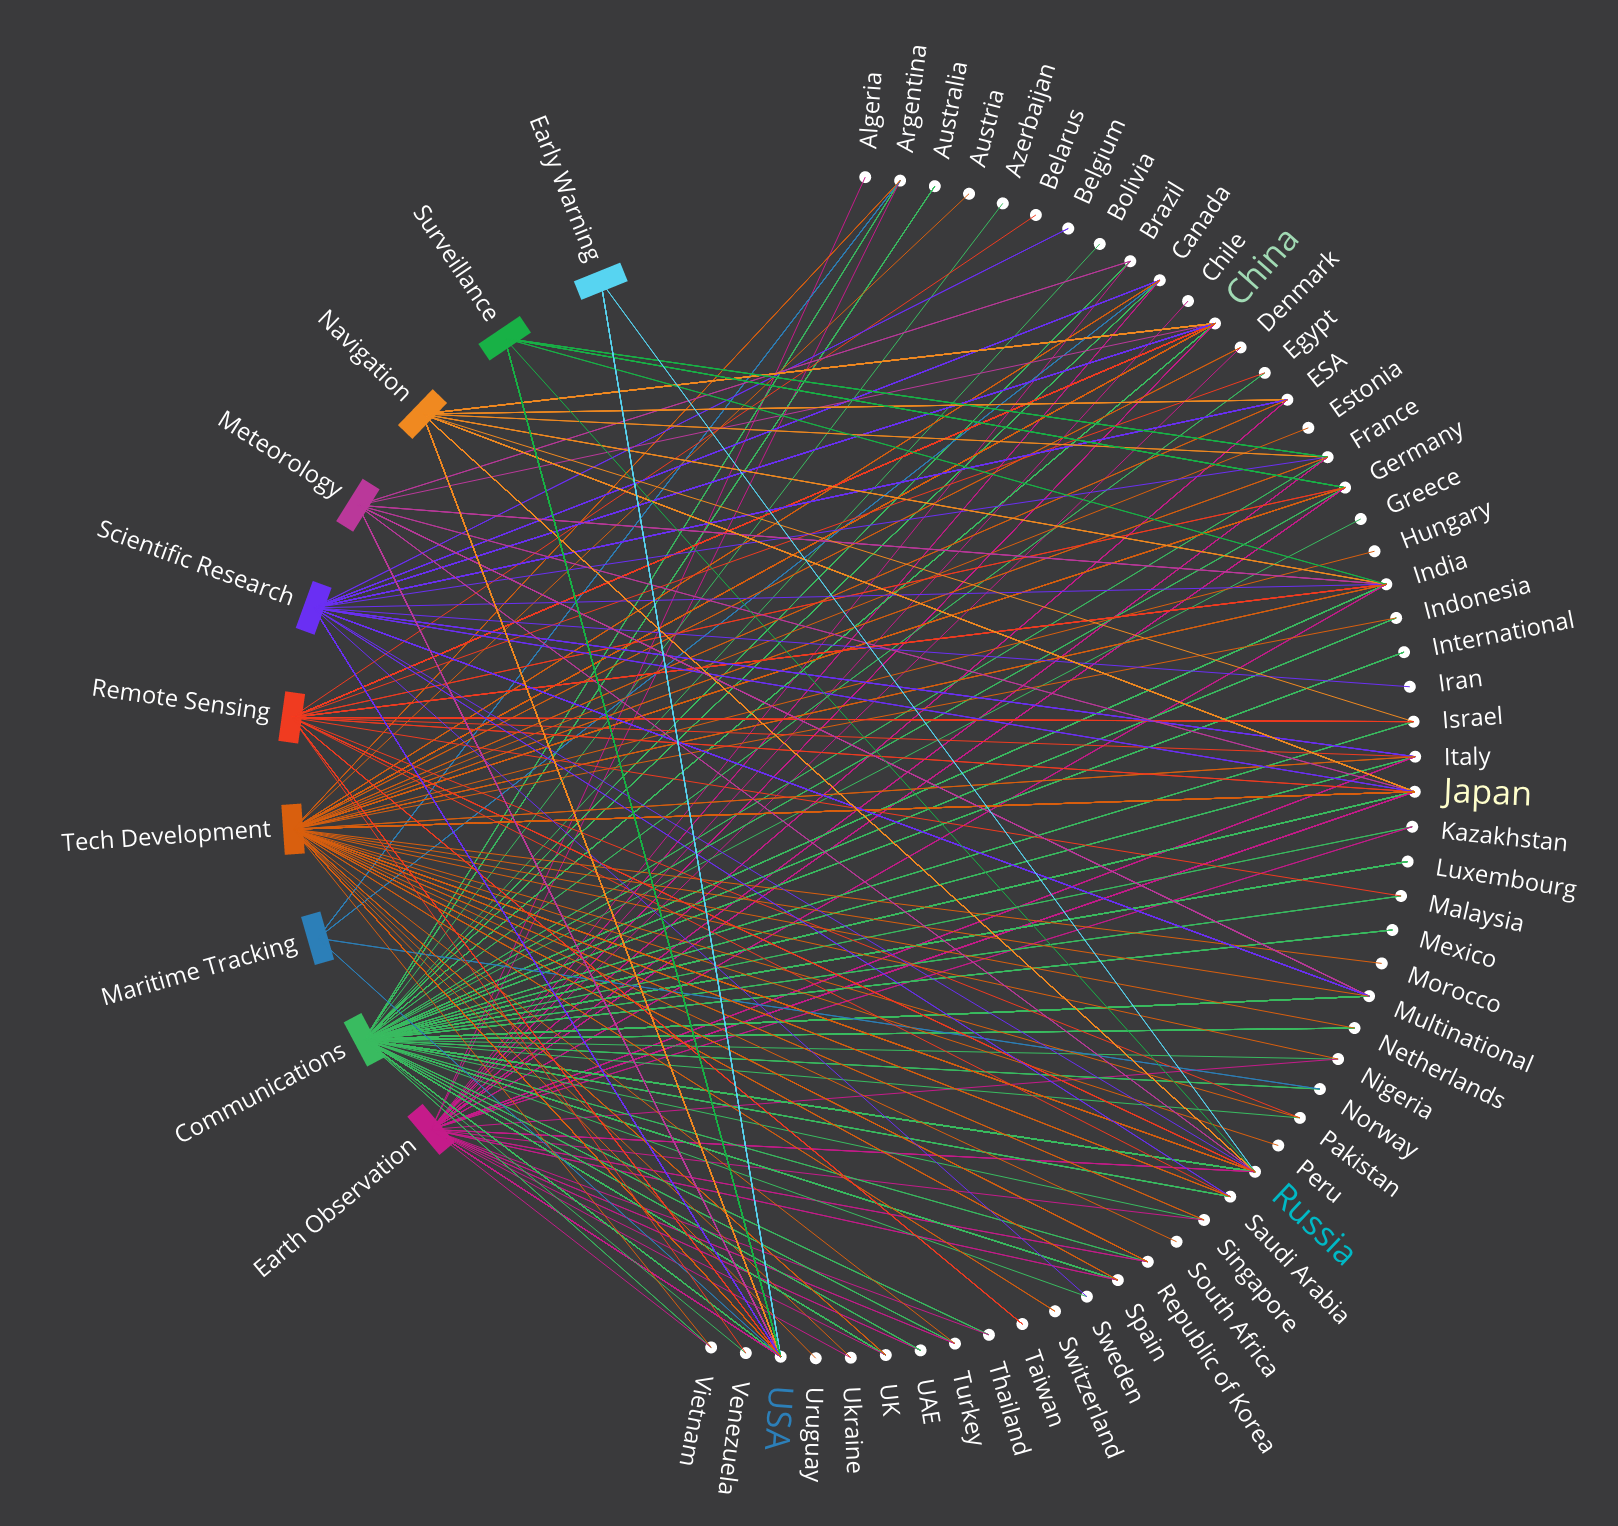
Satellite Data
Exploration of categories of Kickstarter projects and their success rates.Chord graph, bar charts.
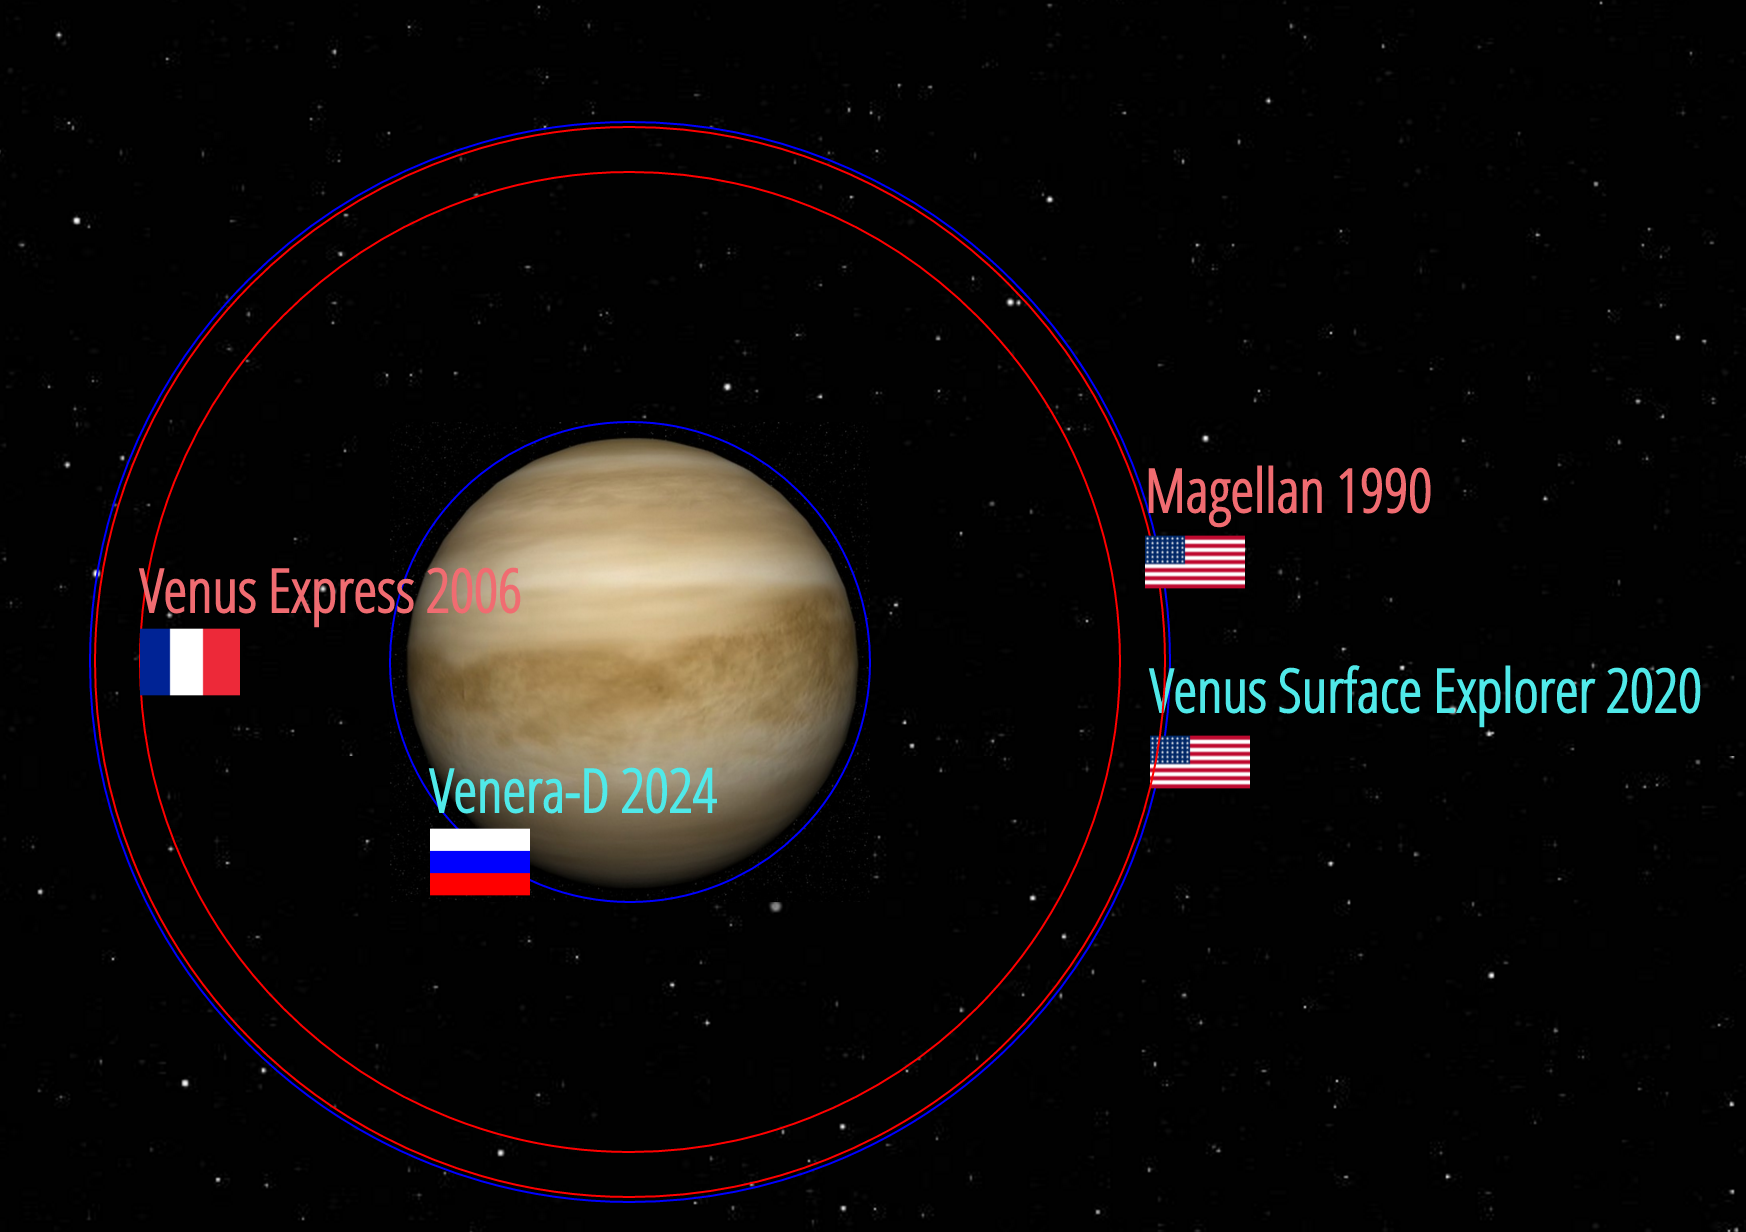
Space Probes
Size of space probe orbits around planets in the Solar System.Orbit radius.
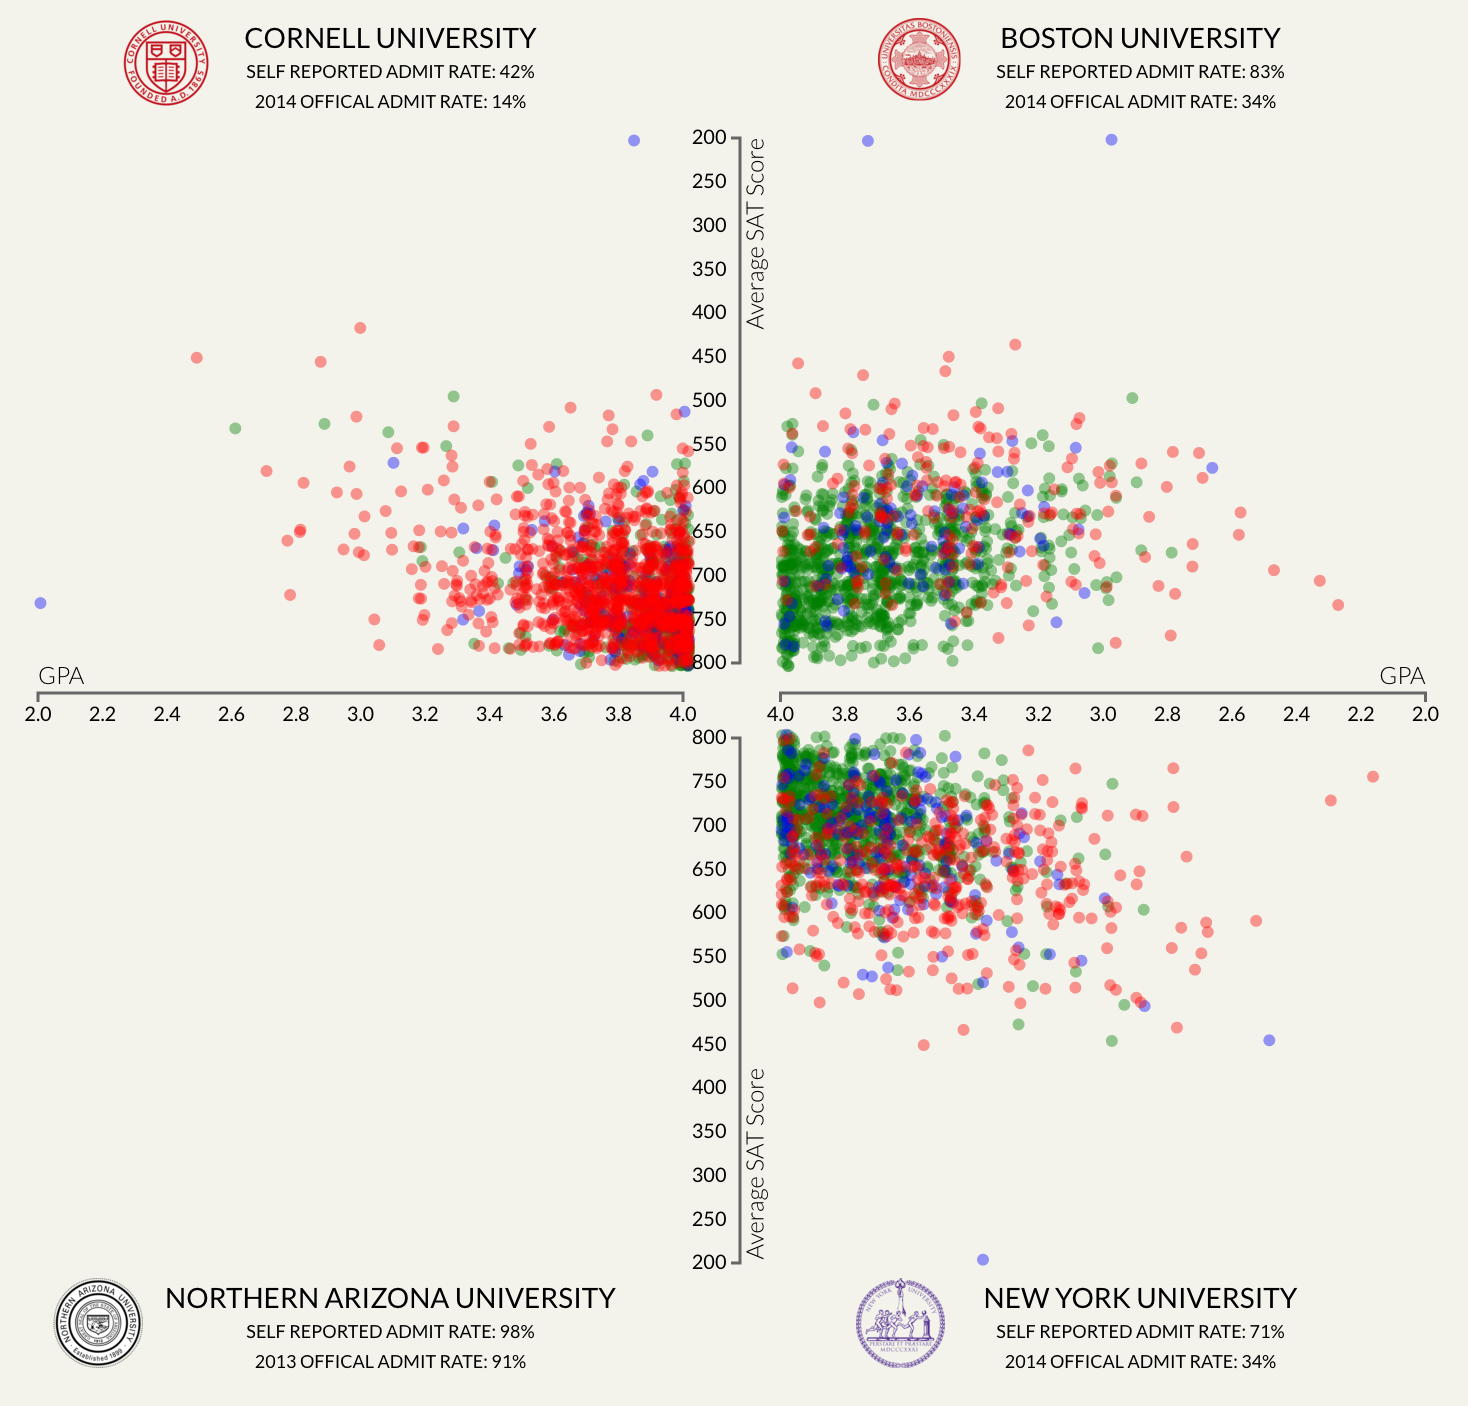
Student Admissions
Comparison of student-reported admission rate to college admission rate.Matrix scatterplot.
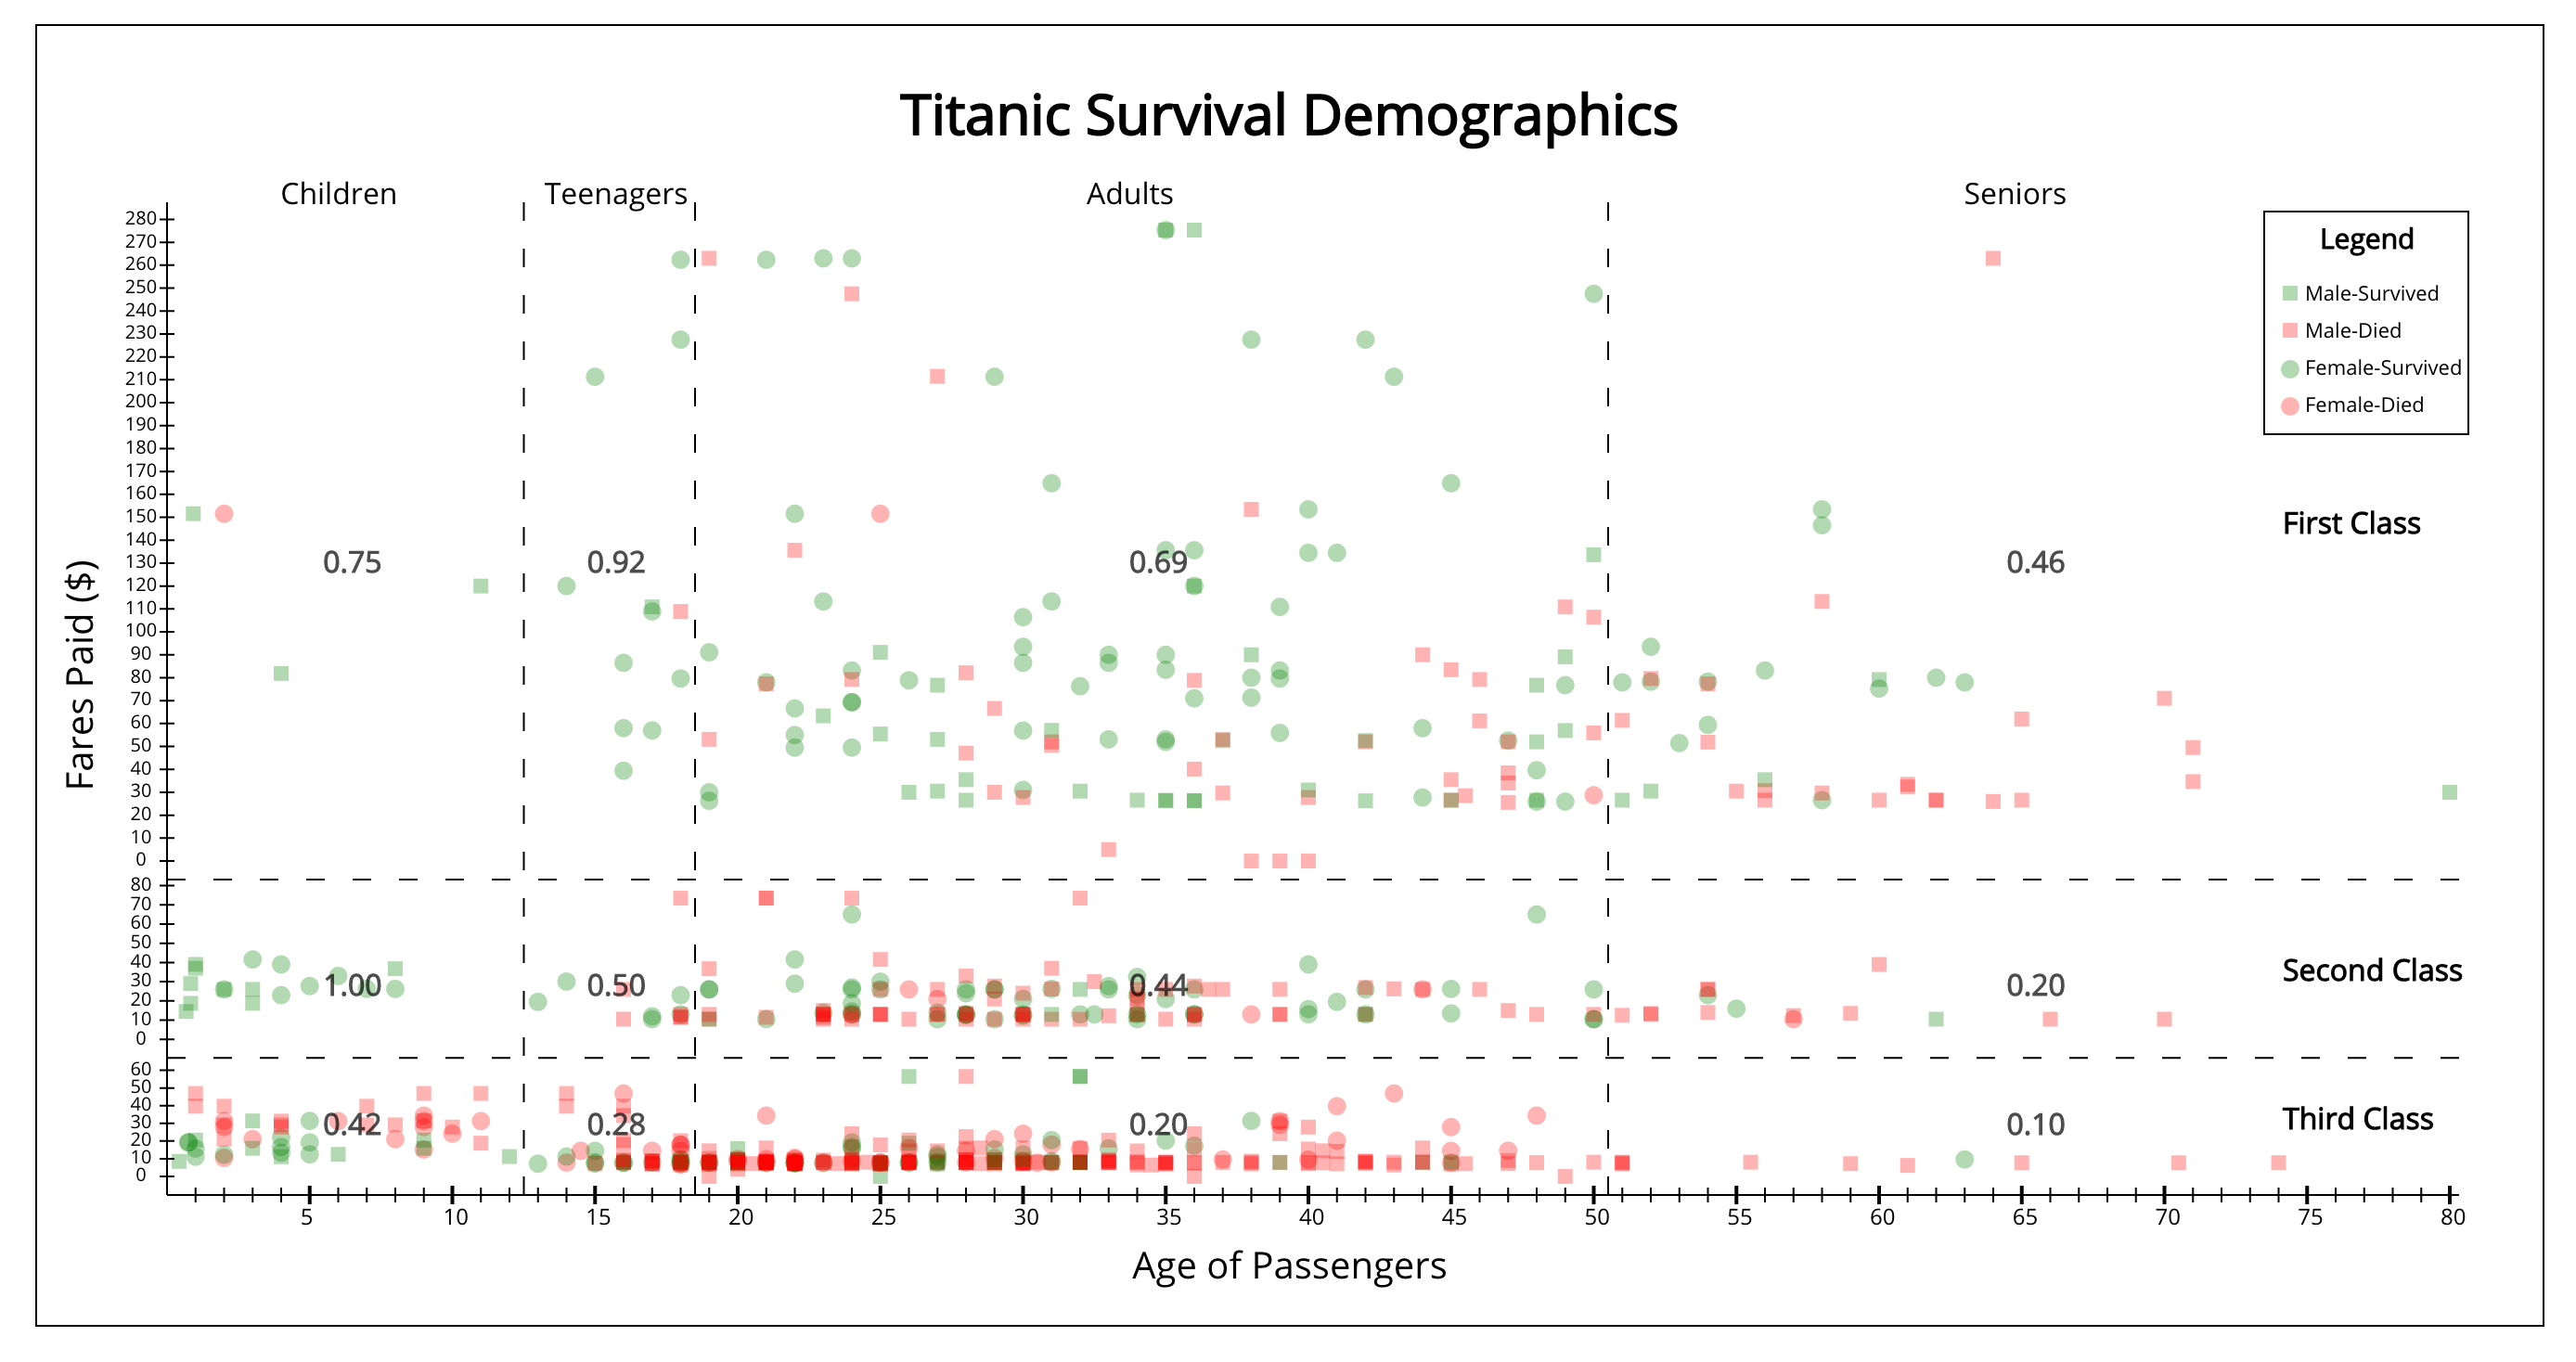
Titanic Survival
Survival rate of the Titanic incident vs. fees paid.Stacked scatterplot.
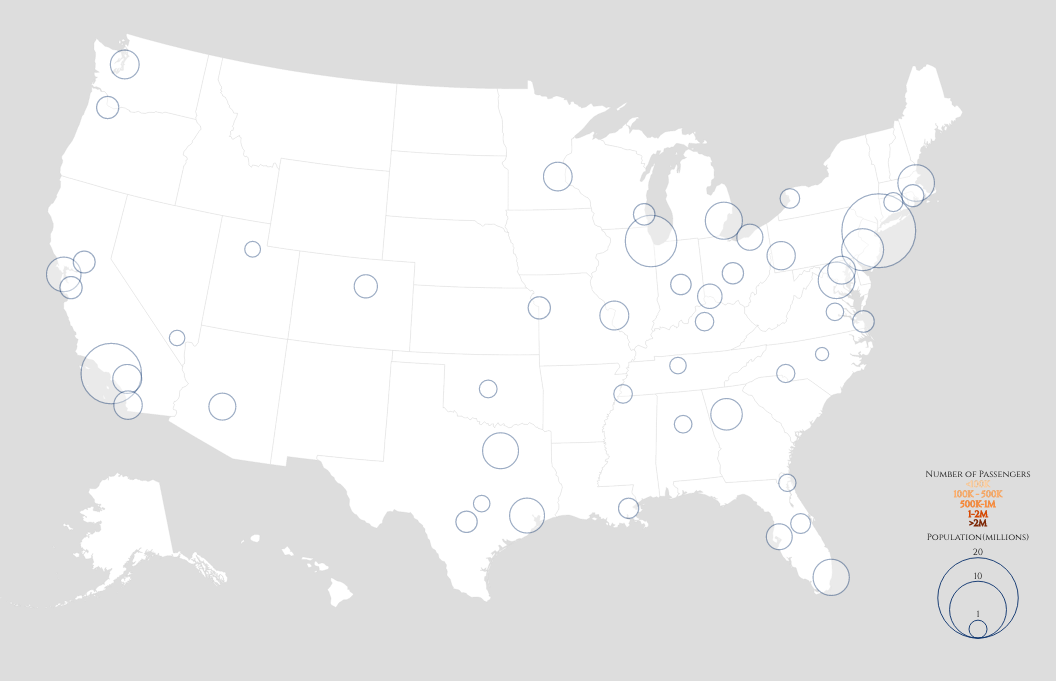
America In The Air
Mapping of air routes from 1990 to 2014.Bubble plot, bar chart, route visualization
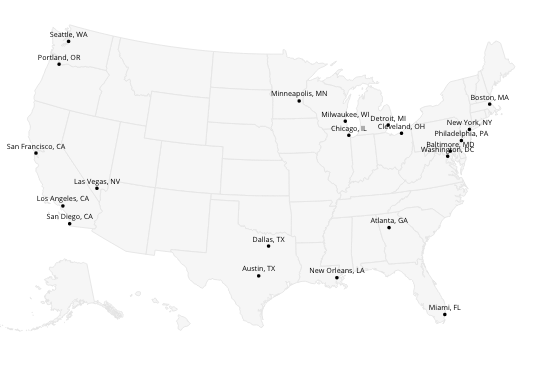
Which U.S. City Should You Live In?
Population preferences survey.Word scaling plot.

Winning Percentages Of Chess Openings
Chess move probabilities.Sunburst plot, stacked bar charts, chessboard.
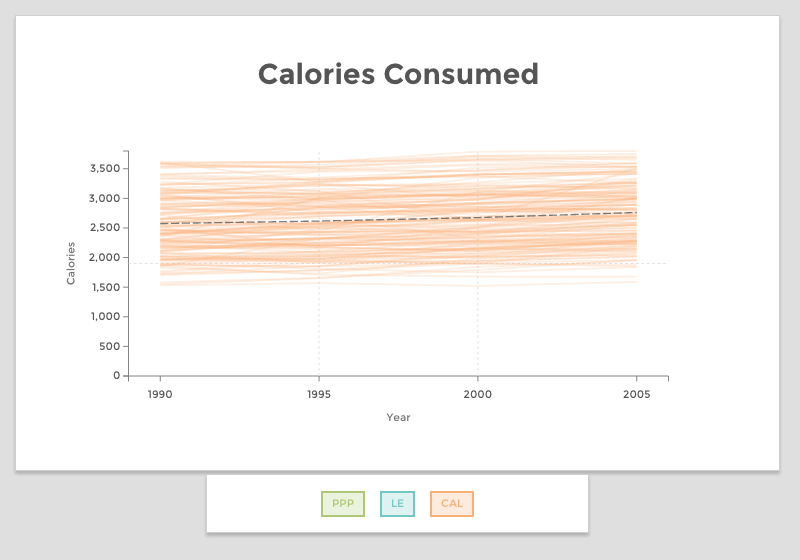
Countries, Calories, and Life Expectancy
Relationship between countries, calories consumed, and life expectancy.Sparklines, time-series plot.
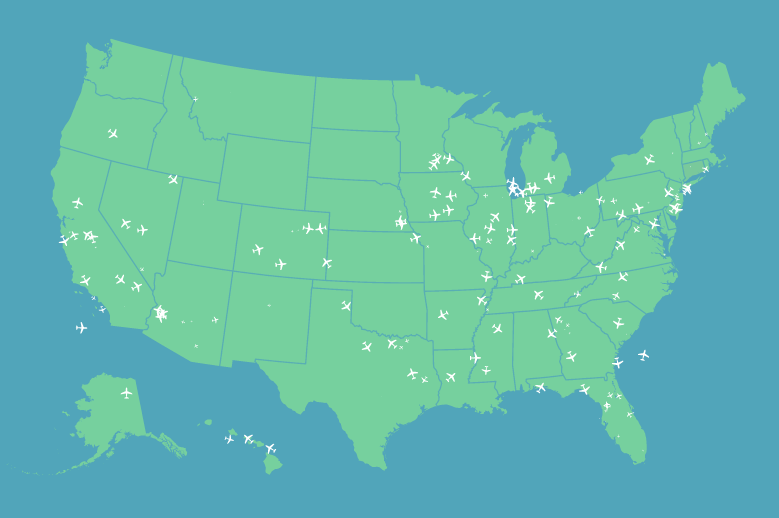
Spread of Diseases in America
Disease spread simulation.Route visualization.
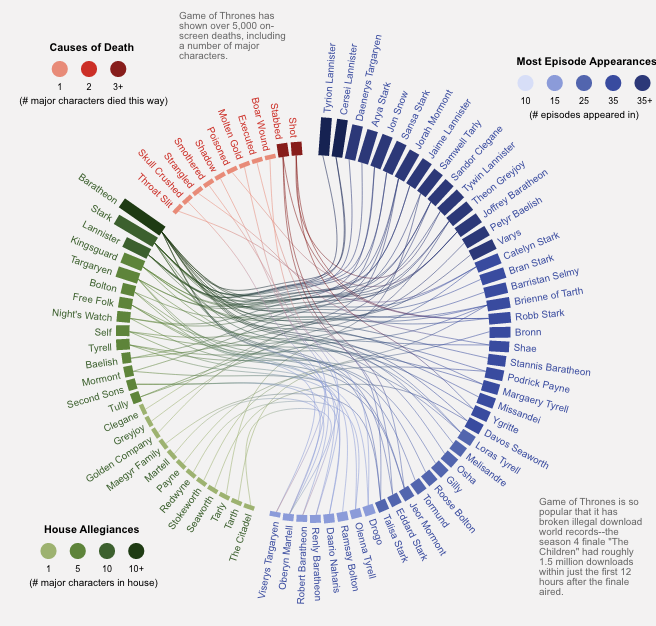
Game of Thrones
Death toll and allegiances by gender.Chord diagram.
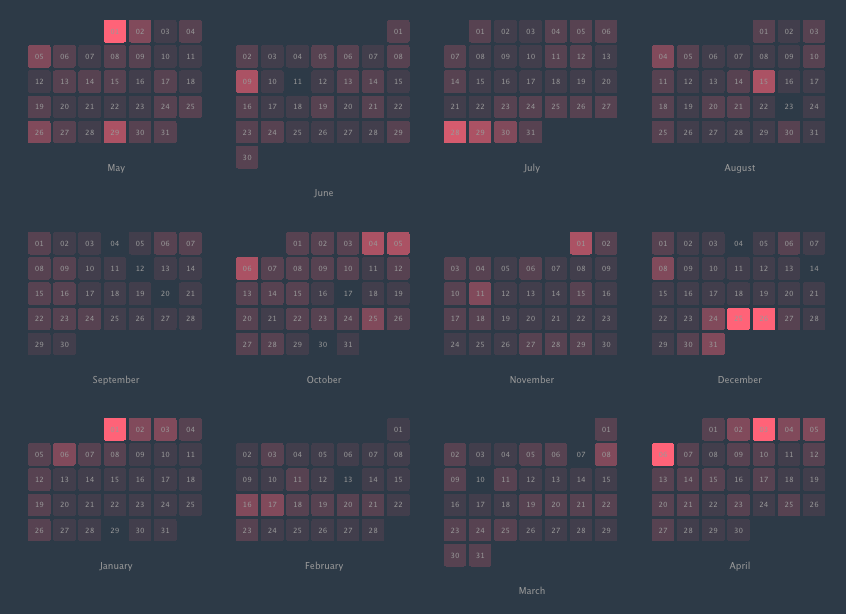
Holiday Frequency
Popularity of holidays and relationship with life expectancy.Calendar heatmap, scatterplot, chloropleth.
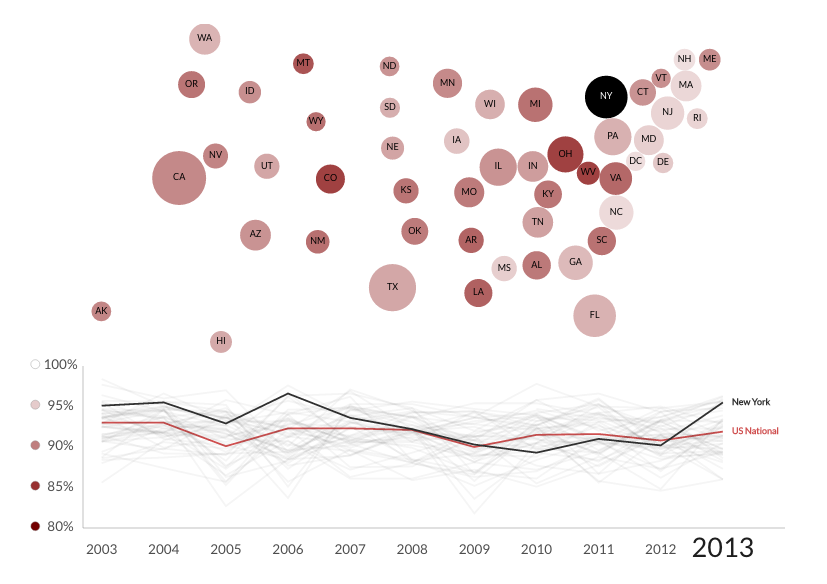
Measles in the Modern Era
Mortality and vaccination statistics.Live counter, categorical plot, bubble plot, time-series plot.
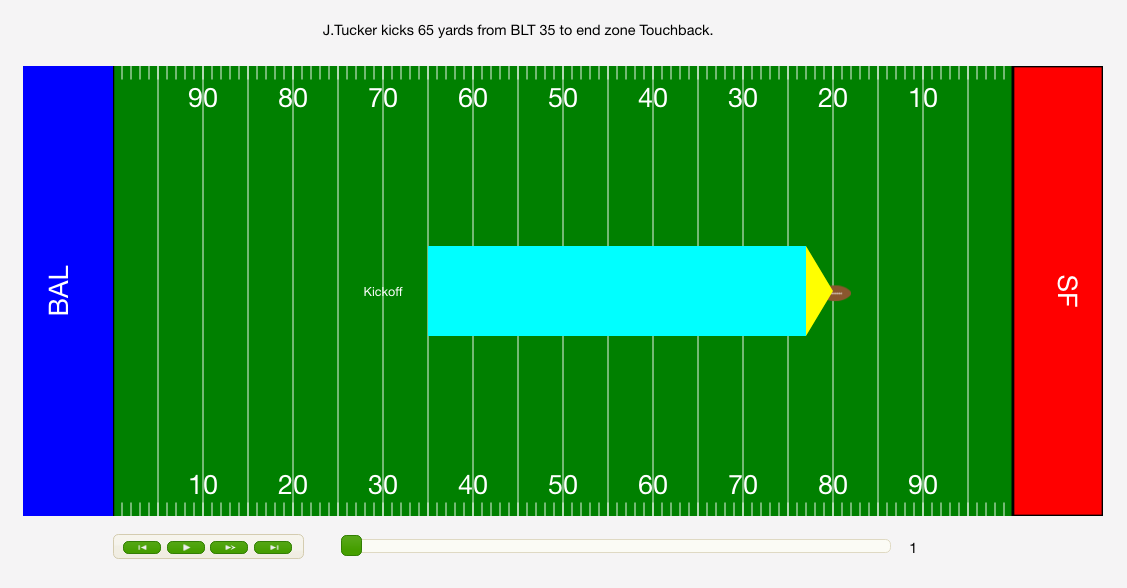
Superbowl
Gameplay simulation.Graphical representation of football field, bar chart.
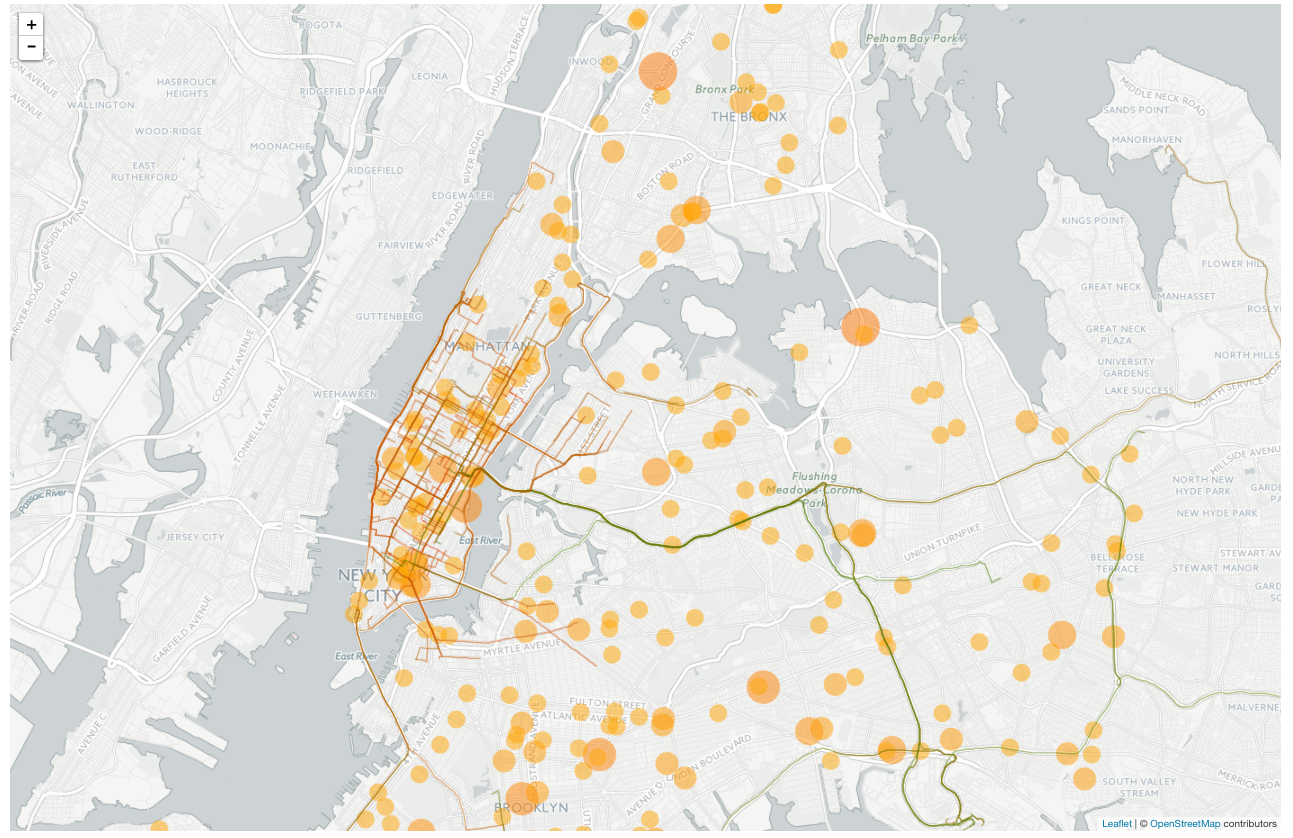
NYC Traffic
Relationship between weather, potholes, traffic, and accidents.Transit information, bubble plot.
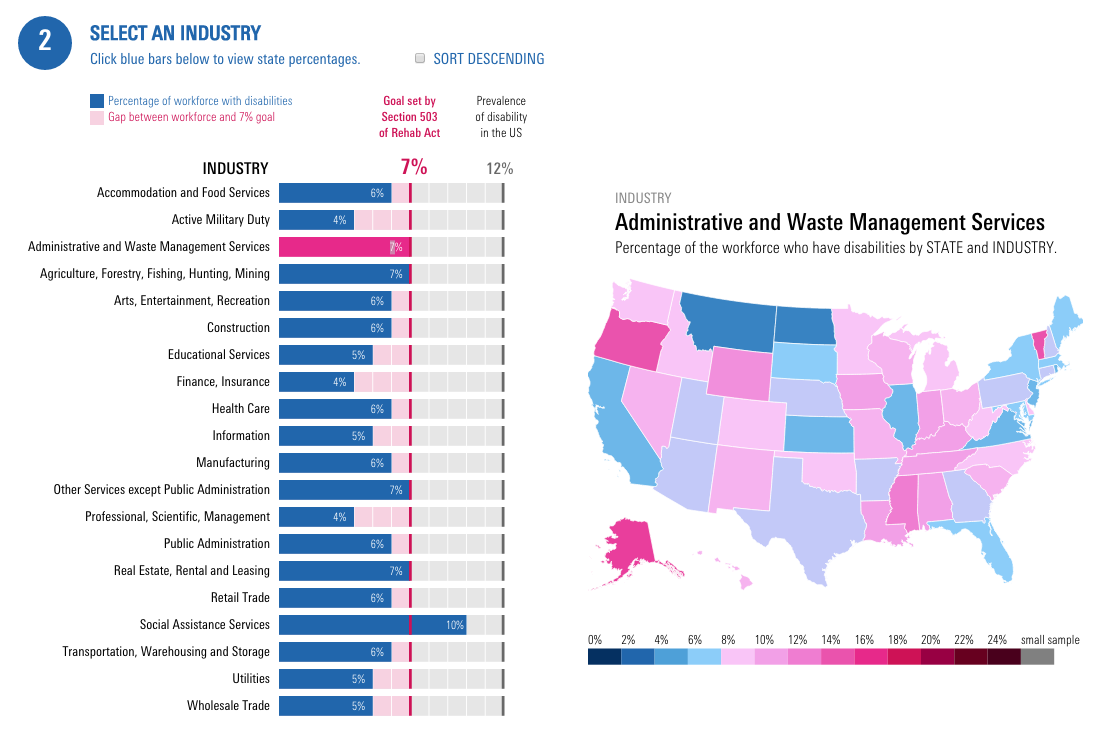
Disabilities
Workforce representation by industry, occupation, and sector.Horizontal bar charts, chloropleth.